Tracing & visualisation
Execution report
Nextflow can create an HTML execution report: a single document which includes many useful metrics about a workflow execution. The report is organised in the three main sections: Summary, Resources and Tasks (see below for details).
To enable the creation of this report add the -with-report command line option when launching the pipeline
execution. For example:
nextflow run <pipeline name> -with-report [file name]
The report file name can be specified as an optional parameter following the report option.
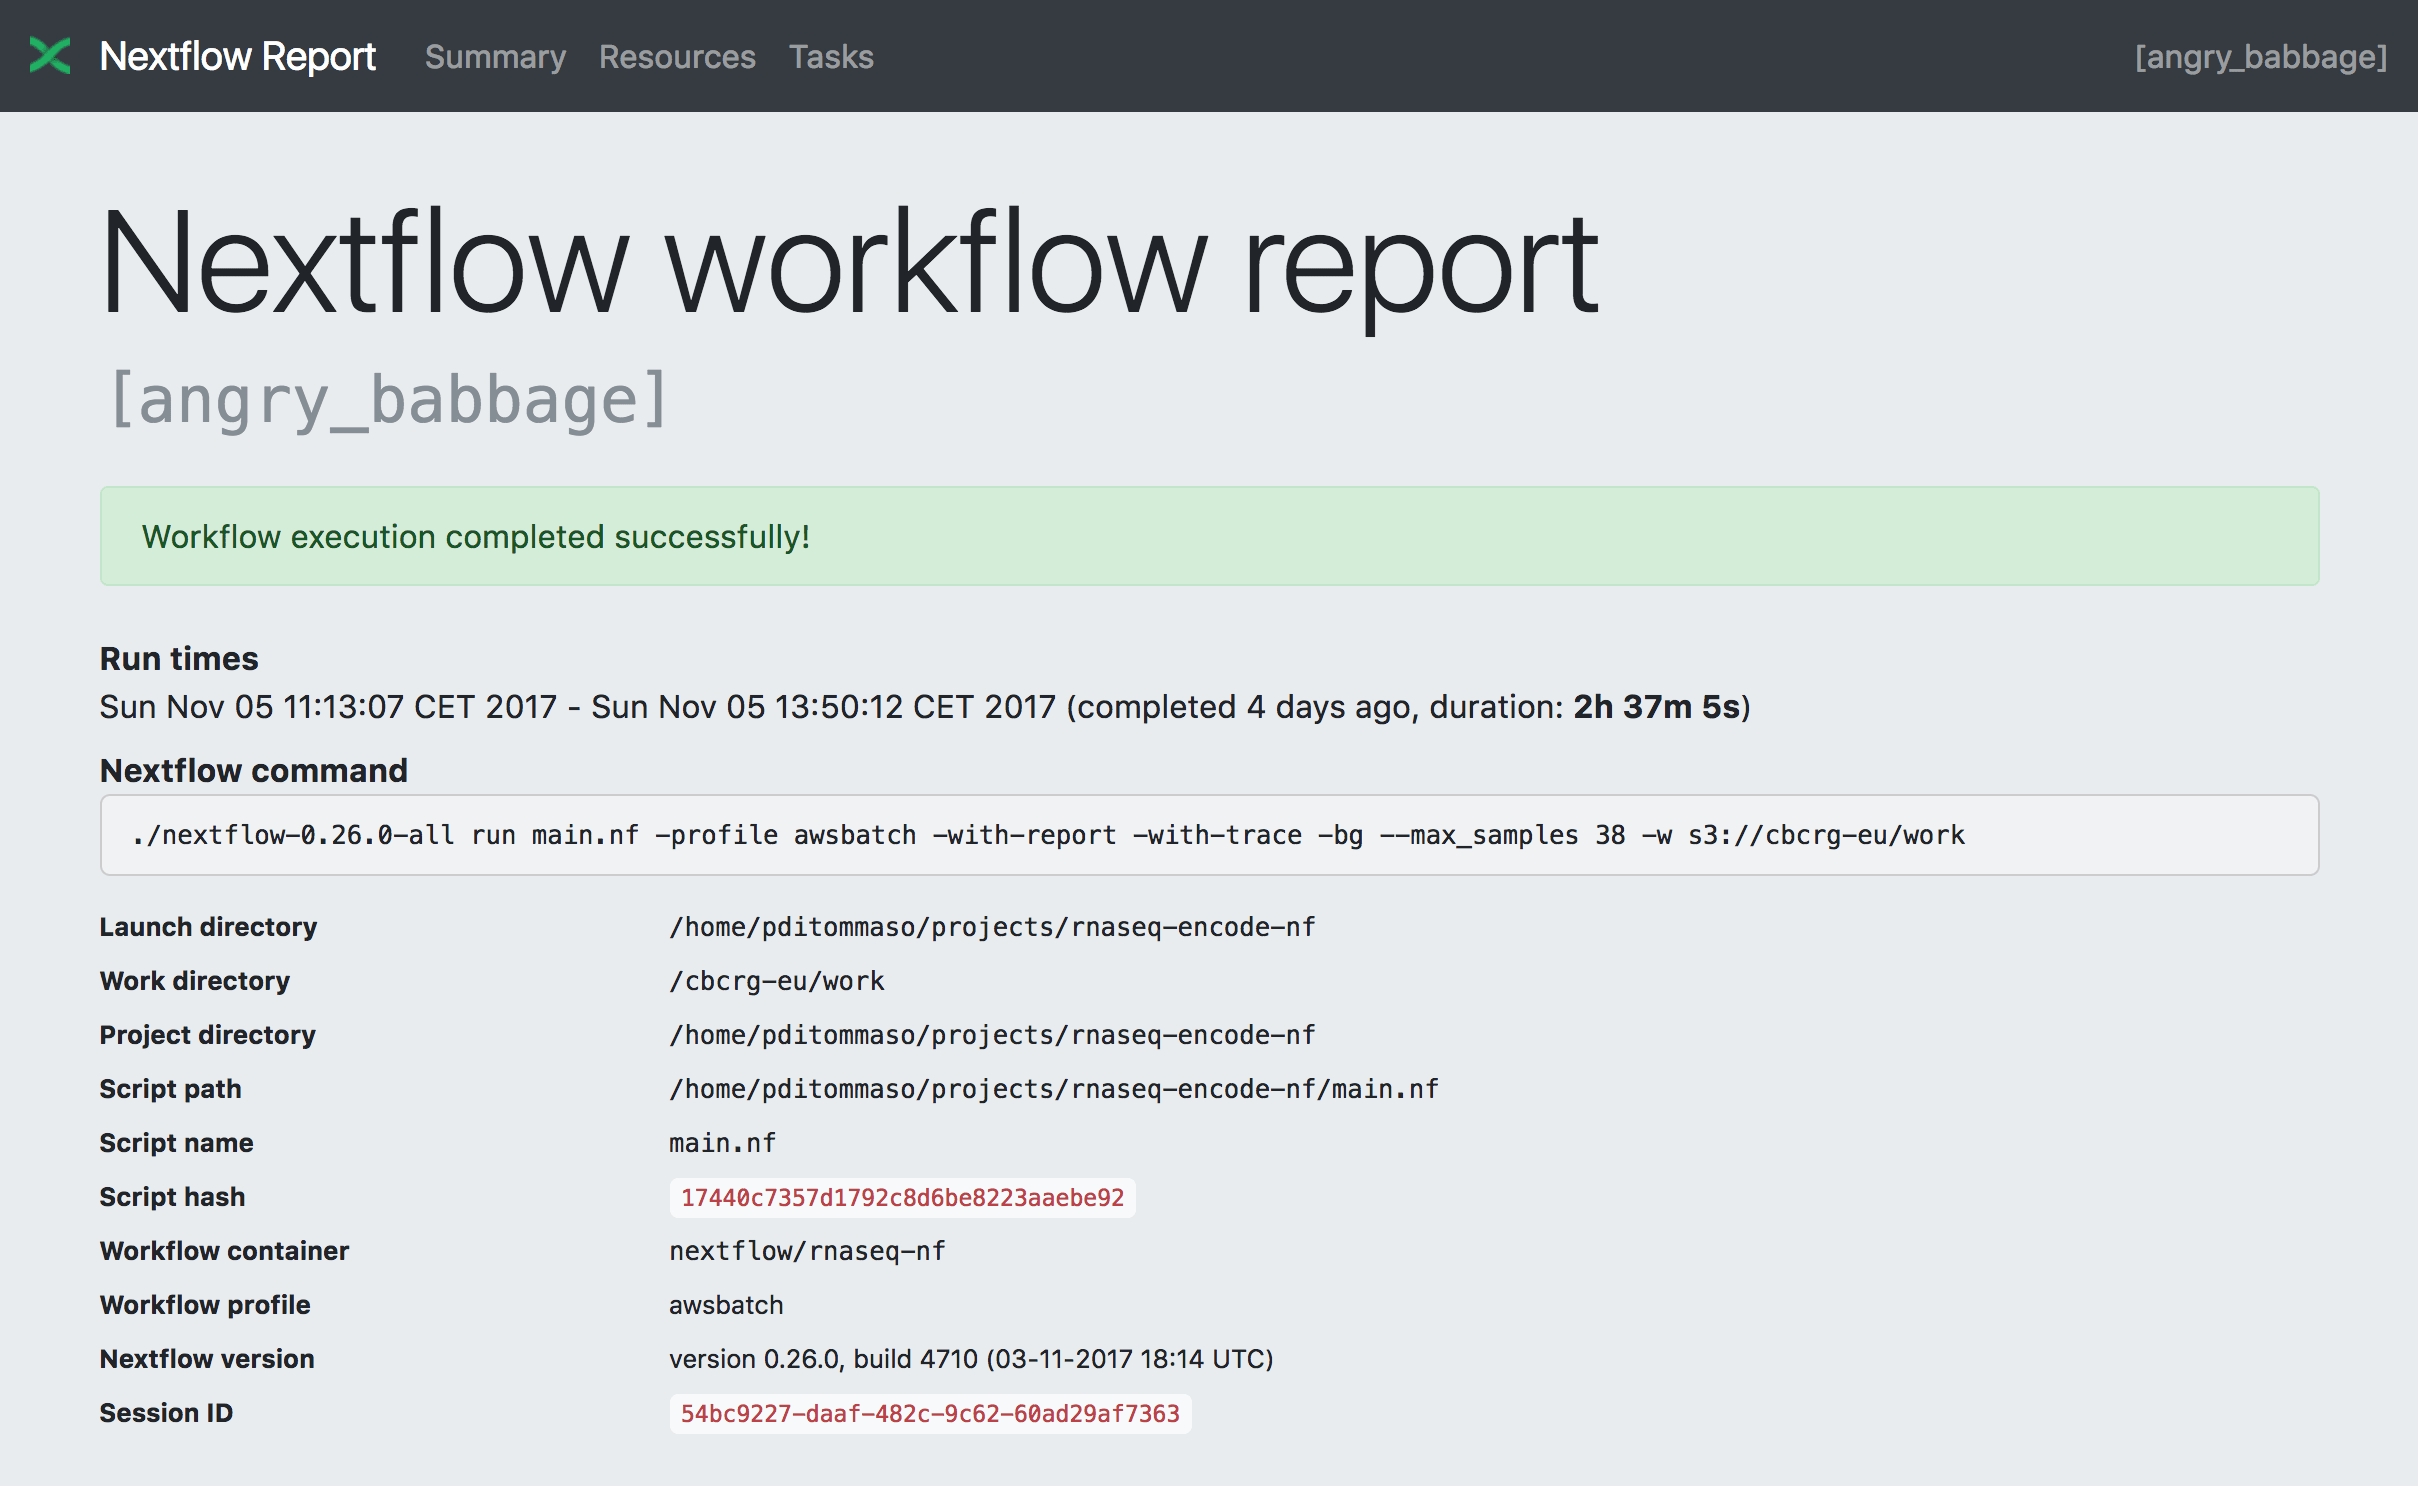
Summary
The Summary section reports the execution status, the launch command, overall execution time and some other workflow metadata. You can see an example below:
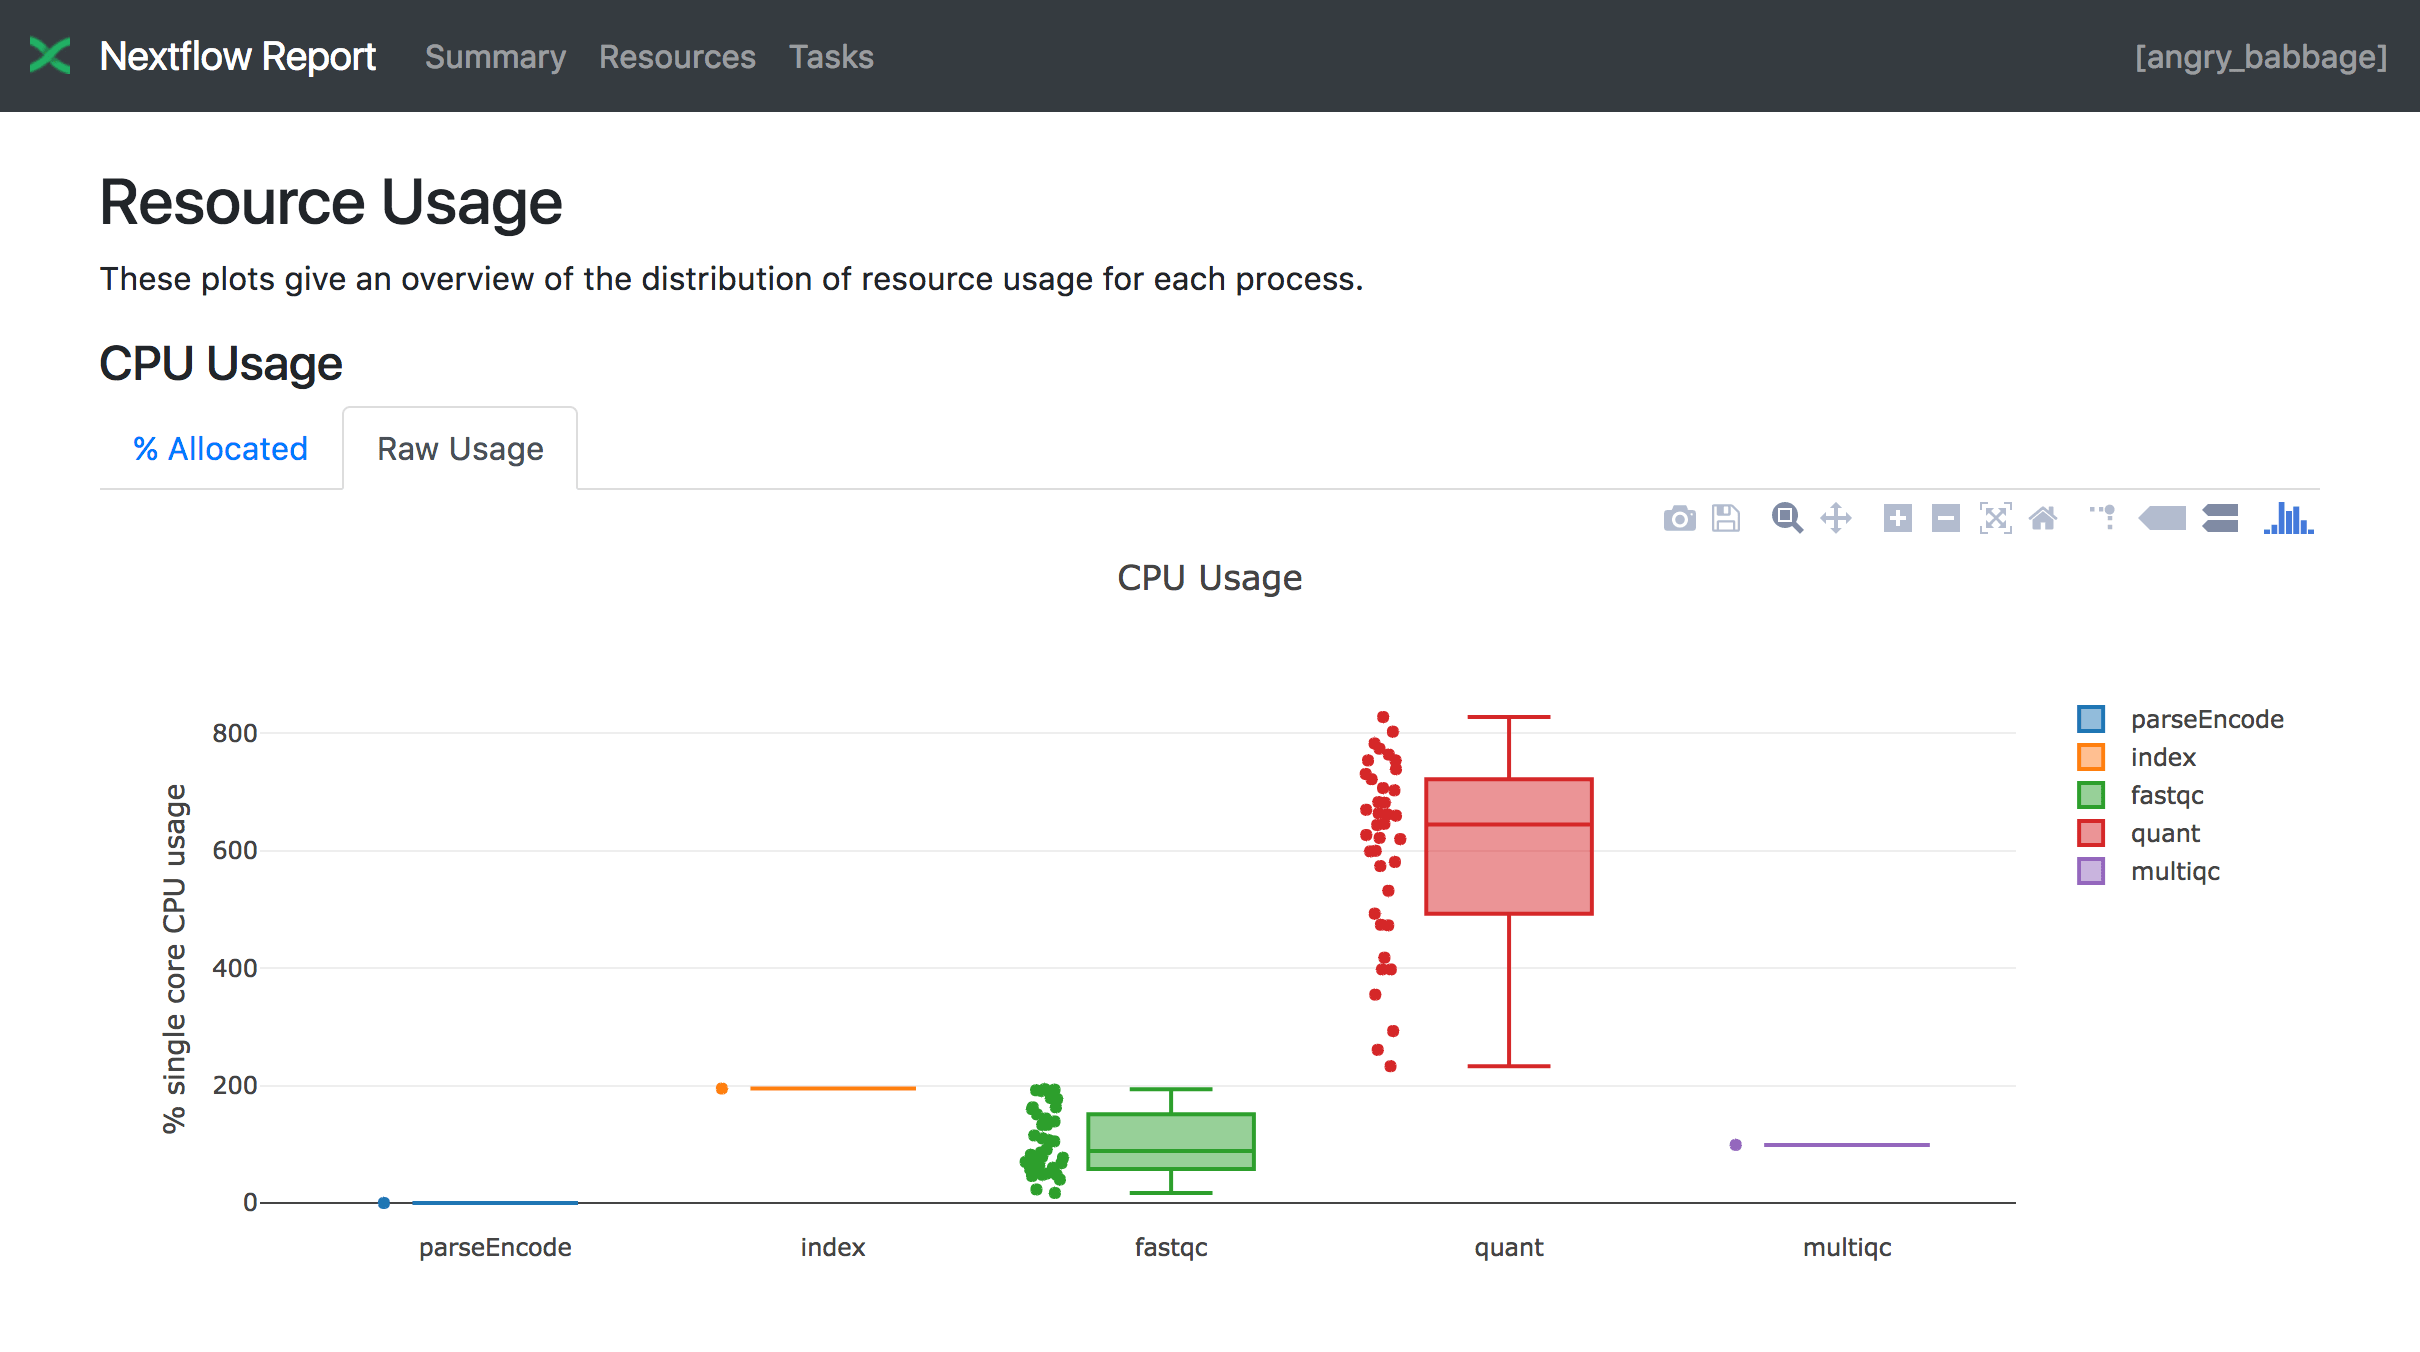
Resources
The Resources sections plots the distributions of resource usages for each workflow process using the interactive HighCharts plotting library.
Plots are shown for CPU, memory, time and disk read+write. The first three have two tabs with the raw values and a percentage representation showing what proportion of the allocated resources were used. This is helpful to check that job pipeline requests are efficient.
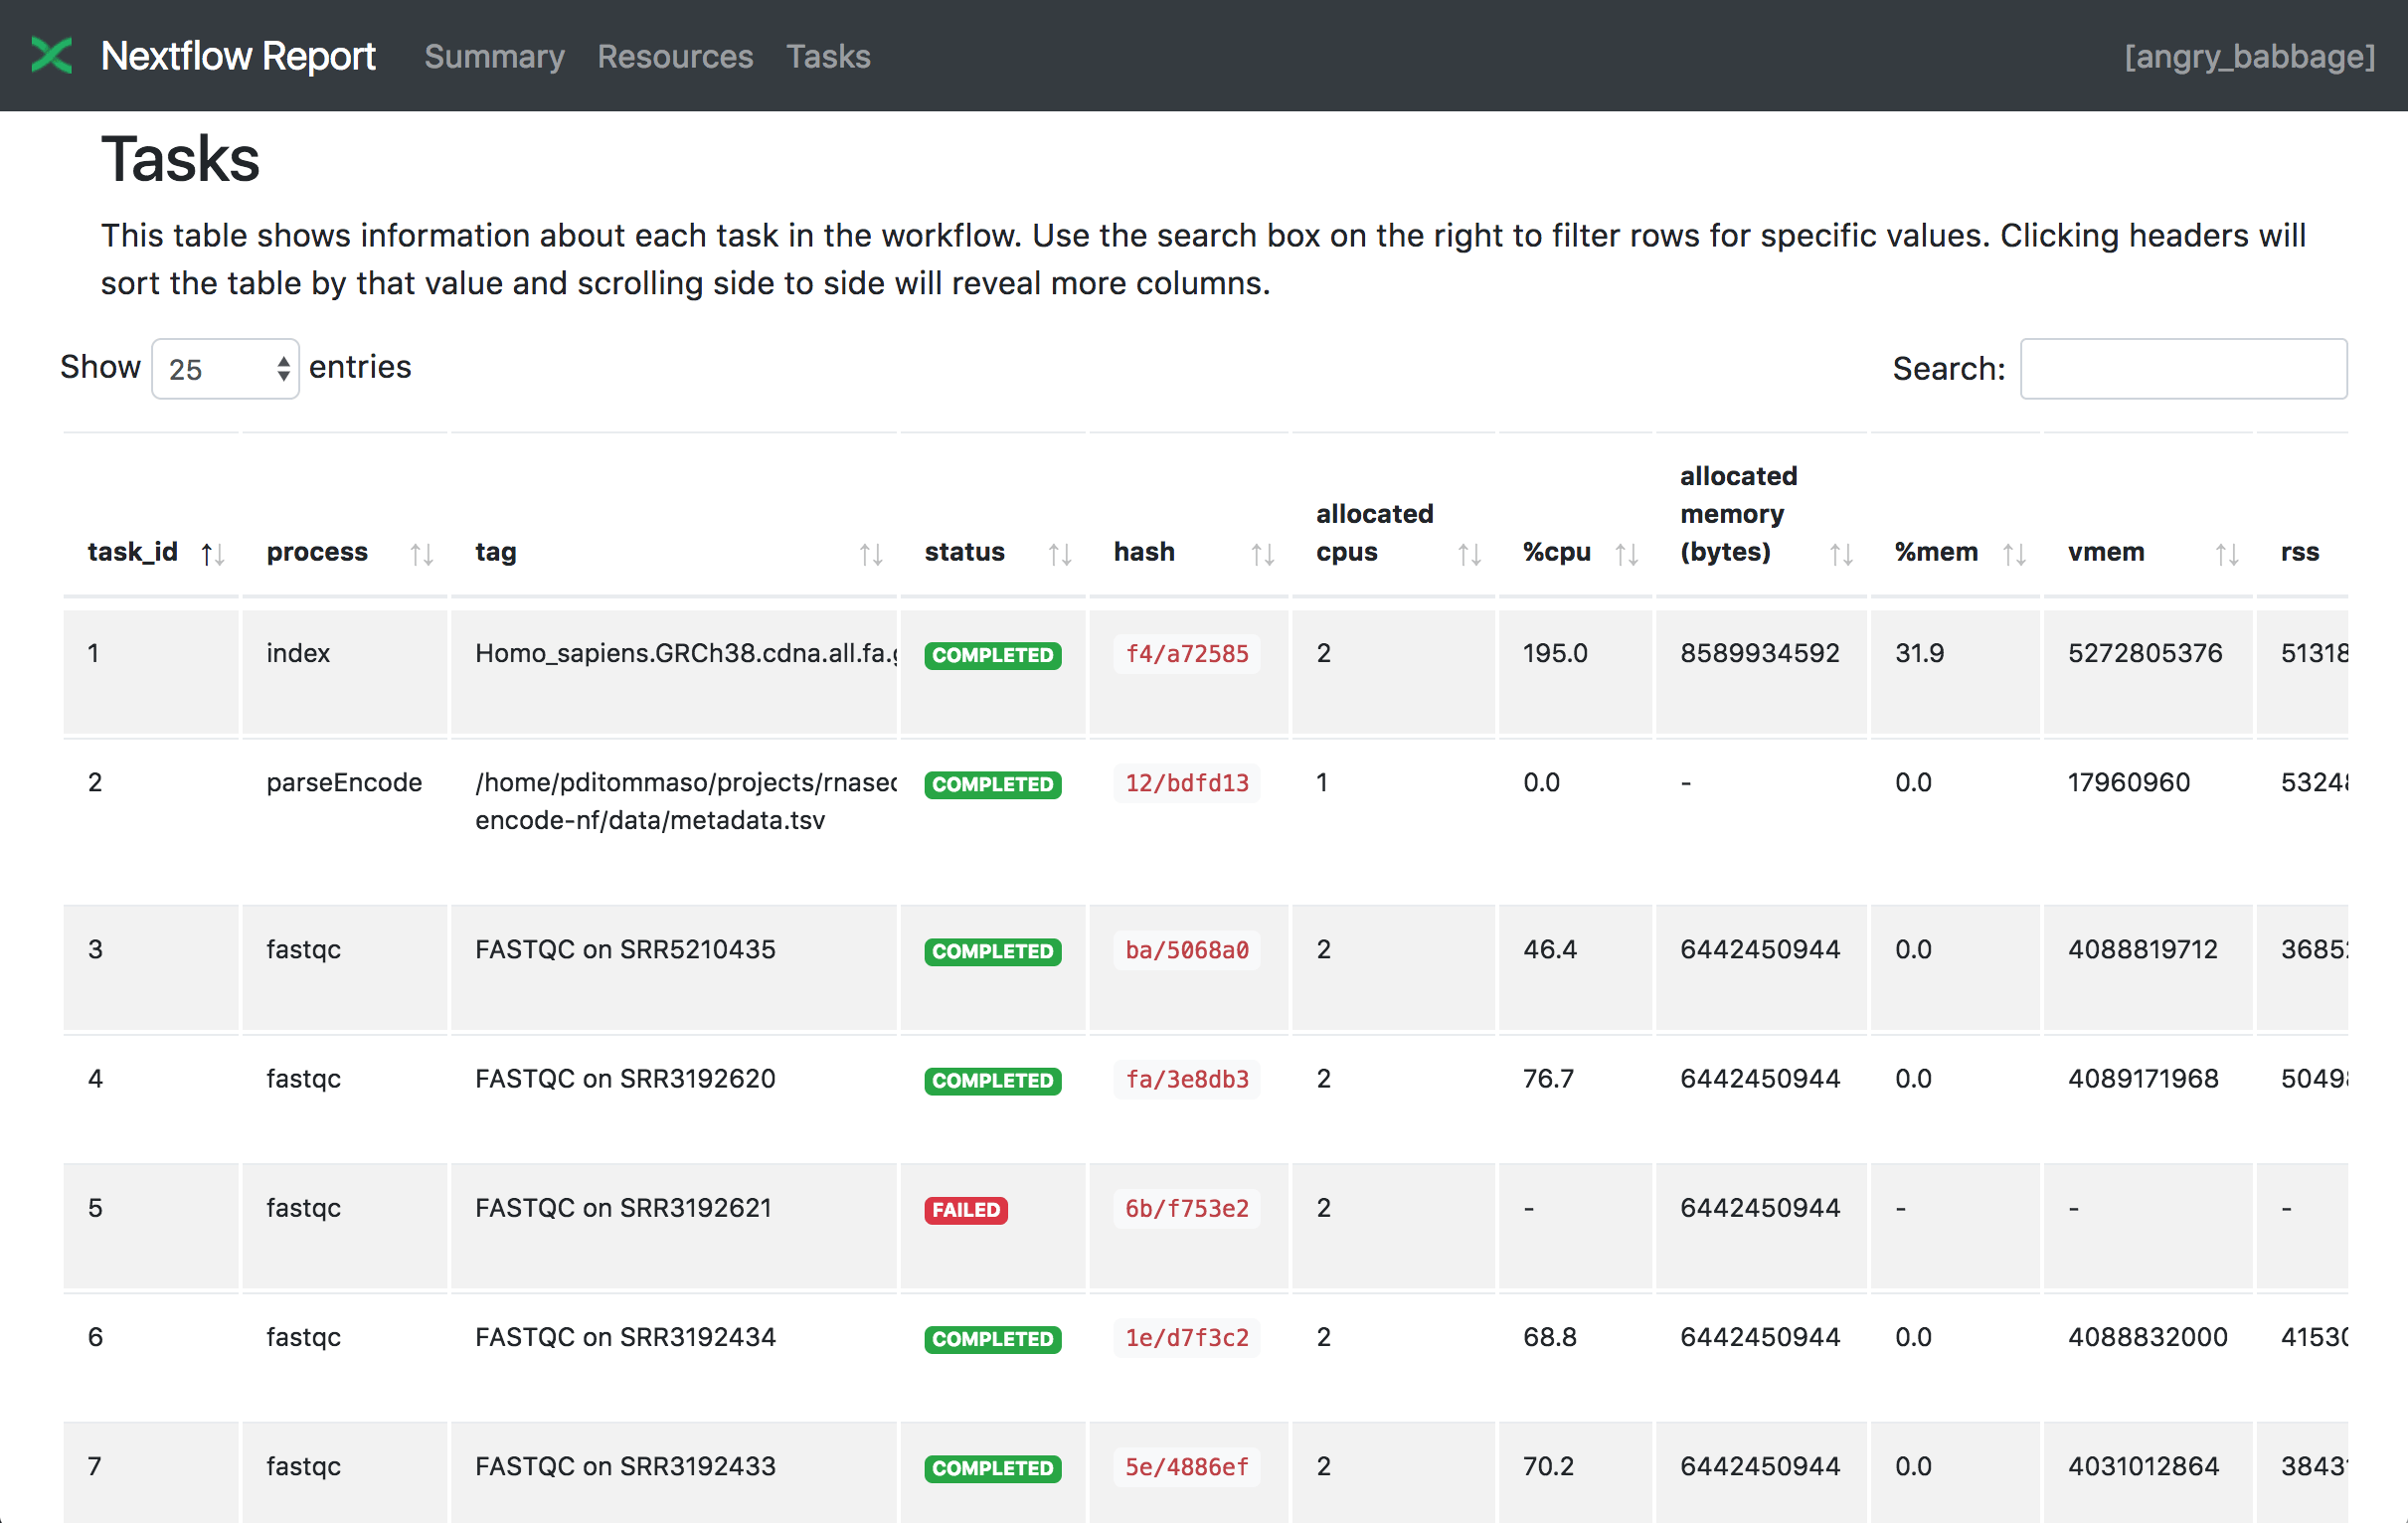
Tasks
Finally the Tasks section lists all executed tasks reporting for each of them, the status, the actual command script and many other runtime metrics. You can see an example below:
Note
Nextflow collect these metrics running a background process for each job in the target environment.
Make sure the following tools are available ps, date, sed, egrep, awk in the system where
the jobs are executed. Moreover some of these metrics are not reported when using a Mac OSX system. See the note
message about that in the Trace report below.
Warning
A common problem when using a third party container image is that it does not ship one or more of the above utilities resulting in an empty execution report.
Please read Report scope section to learn more about the execution report configuration details.
Trace report
Nextflow creates an execution tracing file that contains some useful information about each process executed in your pipeline script, including: submission time, start time, completion time, cpu and memory used.
In order to create the execution trace file add the -with-trace command line option when launching the pipeline execution.
For example:
nextflow run <pipeline name> -with-trace
It will create a file named trace.txt in the current directory. The content looks like the above example:
| task_id | hash | native_id | name | status | exit | submit | duration | walltime | %cpu | rss | vmem | rchar | wchar |
|---|---|---|---|---|---|---|---|---|---|---|---|---|---|
| 19 | 45/ab752a | 2032 | blast (1) | COMPLETED | 0 | 2014-10-23 16:33:16.288 | 1m | 5s | 0.0% | 29.8 MB | 354 MB | 33.3 MB | 0 |
| 20 | 72/db873d | 2033 | blast (2) | COMPLETED | 0 | 2014-10-23 16:34:17.211 | 30s | 10s | 35.7% | 152.8 MB | 428.1 MB | 192.7 MB | 1 MB |
| 21 | 53/d13188 | 2034 | blast (3) | COMPLETED | 0 | 2014-10-23 16:34:17.518 | 29s | 20s | 4.5% | 289.5 MB | 381.6 MB | 33.3 MB | 0 |
| 22 | 26/f65116 | 2035 | blast (4) | COMPLETED | 0 | 2014-10-23 16:34:18.459 | 30s | 9s | 6.0% | 122.8 MB | 353.4 MB | 33.3 MB | 0 |
| 23 | 88/bc00e4 | 2036 | blast (5) | COMPLETED | 0 | 2014-10-23 16:34:18.507 | 30s | 19s | 5.0% | 195 MB | 395.8 MB | 65.3 MB | 121 KB |
| 24 | 74/2556e9 | 2037 | blast (6) | COMPLETED | 0 | 2014-10-23 16:34:18.553 | 30s | 12s | 43.6% | 140.7 MB | 432.2 MB | 192.7 MB | 182.7 MB |
| 28 | b4/0f9613 | 2041 | exonerate (1) | COMPLETED | 0 | 2014-10-23 16:38:19.657 | 1m 30s | 1m 11s | 94.3% | 611.6 MB | 693.8 MB | 961.2 GB | 6.1 GB |
| 32 | af/7f2f57 | 2044 | exonerate (4) | COMPLETED | 0 | 2014-10-23 16:46:50.902 | 1m 1s | 38s | 36.6% | 115.8 MB | 167.8 MB | 364 GB | 5.1 GB |
| 33 | 37/ab1fcc | 2045 | exonerate (5) | COMPLETED | 0 | 2014-10-23 16:47:51.625 | 30s | 12s | 59.6% | 696 MB | 734.6 MB | 354.3 GB | 420.4 MB |
| 31 | d7/eabe51 | 2042 | exonerate (3) | COMPLETED | 0 | 2014-10-23 16:45:50.846 | 3m 1s | 2m 6s | 130.1% | 703.3 MB | 760.9 MB | 1.1 TB | 28.6 GB |
| 36 | c4/d6cc15 | 2048 | exonerate (6) | COMPLETED | 0 | 2014-10-23 16:48:48.718 | 3m 1s | 2m 43s | 116.6% | 682.1 MB | 743.6 MB | 868.5 GB | 42 GB |
| 30 | 4f/1ad1f0 | 2043 | exonerate (2) | COMPLETED | 0 | 2014-10-23 16:45:50.961 | 10m 2s | 9m 16s | 95.5% | 706.2 MB | 764 MB | 1.6 TB | 172.4 GB |
| 52 | 72/41d0c6 | 2055 | similarity (1) | COMPLETED | 0 | 2014-10-23 17:13:23.543 | 30s | 352ms | 0.0% | 35.6 MB | 58.3 MB | 199.3 MB | 7.9 MB |
| 57 | 9b/111b5e | 2058 | similarity (6) | COMPLETED | 0 | 2014-10-23 17:13:23.655 | 30s | 488ms | 0.0% | 108.2 MB | 158 MB | 317.1 MB | 9.8 MB |
| 53 | 3e/bca30f | 2061 | similarity (2) | COMPLETED | 0 | 2014-10-23 17:13:23.770 | 30s | 238ms | 0.0% | 6.7 MB | 29.6 MB | 190 MB | 91.2 MB |
| 54 | 8b/d45b47 | 2062 | similarity (3) | COMPLETED | 0 | 2014-10-23 17:13:23.808 | 30s | 442ms | 0.0% | 108.1 MB | 158 MB | 832 MB | 565.6 MB |
| 55 | 51/ac19c6 | 2064 | similarity (4) | COMPLETED | 0 | 2014-10-23 17:13:23.873 | 30s | 6s | 0.0% | 112.7 MB | 162.8 MB | 4.9 GB | 3.9 GB |
| 56 | c3/ec5f4a | 2066 | similarity (5) | COMPLETED | 0 | 2014-10-23 17:13:23.948 | 30s | 616ms | 0.0% | 10.4 MB | 34.6 MB | 238 MB | 8.4 MB |
| 98 | de/d6c0a6 | 2099 | matrix (1) | COMPLETED | 0 | 2014-10-23 17:14:27.139 | 30s | 1s | 0.0% | 4.8 MB | 42 MB | 240.6 MB | 79 KB |
The following table shows the fields that can be included in the execution report:
| Name | Description |
|---|---|
| task_id | Task ID. |
| hash | Task hash code. |
| native_id | Task ID given by the underlying execution system e.g. POSIX process PID when executed locally, job ID when executed by a grid engine, etc. |
| process | Nextflow process name. |
| tag | User provided identifier associated this task. |
| name | Task name. |
| status | Task status. |
| exit | POSIX process exit status. |
| module | Environment module used to run the task. |
| container | Docker image name used to execute the task. |
| cpus | The cpus number request for the task execution. |
| time | The time request for the task execution |
| disk | The disk space request for the task execution. |
| memory | The memory request for the task execution. |
| attempt | Attempt at which the task completed. |
| submit | Timestamp when the task has been submitted. |
| start | Timestamp when the task execution has started. |
| complete | Timestamp when task execution has completed. |
| duration | Time elapsed to complete since the submission. |
| realtime | Task execution time i.e. delta between completion and start timestamp. |
| queue | The queue that the executor attempted to run the process on. |
| %cpu | Percentage of CPU used by the process. |
| %mem | Percentage of memory used by the process. |
| rss | Real memory (resident set) size of the process. Equivalent to ps -o rss . |
| vmem | Virtual memory size of the process. Equivalent to ps -o vsize . |
| * peak_rss | Peak of real memory. This data is read from field VmHWM in /proc/$pid/status file. |
| * peak_vmem | Peak of virtual memory. This data is read from field VmPeak in /proc/$pid/status file. |
| * rchar | Number of bytes the process read, using any read-like system call from files, pipes, tty, etc. This data is read from file /proc/$pid/io. |
| * wchar | Number of bytes the process wrote, using any write-like system call. This data is read from file /proc/$pid/io. |
| * syscr | Number of read-like system call invocations that the process performed. This data is read from file /proc/$pid/io. |
| * syscw | Number of write-like system call invocations that the process performed. This data is read from file /proc/$pid/io. |
| * read_bytes | Number of bytes the process directly read from disk. This data is read from file /proc/$pid/io. |
| * write_bytes | Number of bytes the process originally dirtied in the page-cache (assuming they will go to disk later). This data is read from file /proc/$pid/io. |
Note
Fields marked with (*) are not available when running the tracing on Mac OSX. Also note that the Mac OSX default date utility,
has a time resolution limited to seconds. For a more detailed time tracing it is suggested to install
GNU coreutils package that includes the standard one.
Warning
These numbers provide an estimation of the resources used by running tasks. They should not be intended as an alternative to low level performance analysis provided by other tools and they may not be fully accurate, in particular for very short tasks (taking less than one minute).
Trace report layout and other configuration settings can be specified by using the nextflow.config configuration file.
Please read Trace scope section to learn more about it.
Timeline report
Nextflow can render an HTML timeline for all processes executed in your pipeline. An example of the timeline report is shown below:
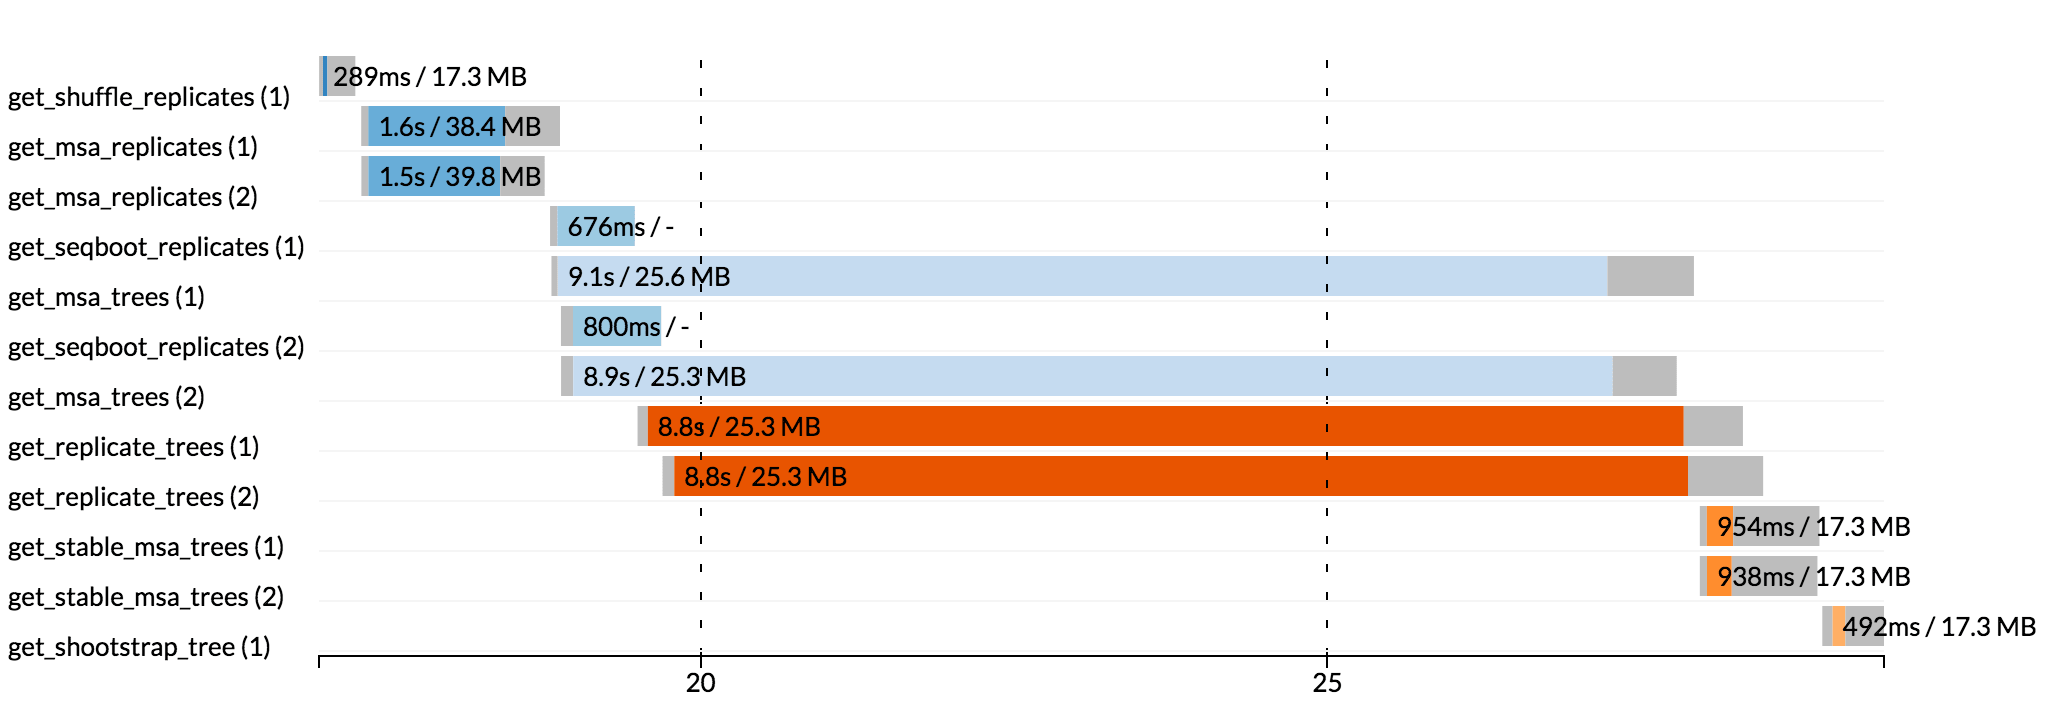
Each bar represents a process run in the pipeline execution. The bar length represents the task duration time (wall-time). The colored area in each bar represents the real execution time. The grey area to the left of the colored area represents the task scheduling wait time. The grey area to the right of the colored area represents the task termination time (clean-up and file un-staging). The numbers on the x-axis represent the time in absolute units eg. minutes, hours, etc.
Each bar displays two numbers: the task duration time and the virtual memory size peak.
As each process can spawn many tasks, colors are used to identify those tasks belonging to the same process.
To enable the creation of the timeline report add the -with-timeline command line option when launching the pipeline
execution. For example:
nextflow run <pipeline name> -with-timeline [file name]
The report file name can be specified as an optional parameter following the timeline option.
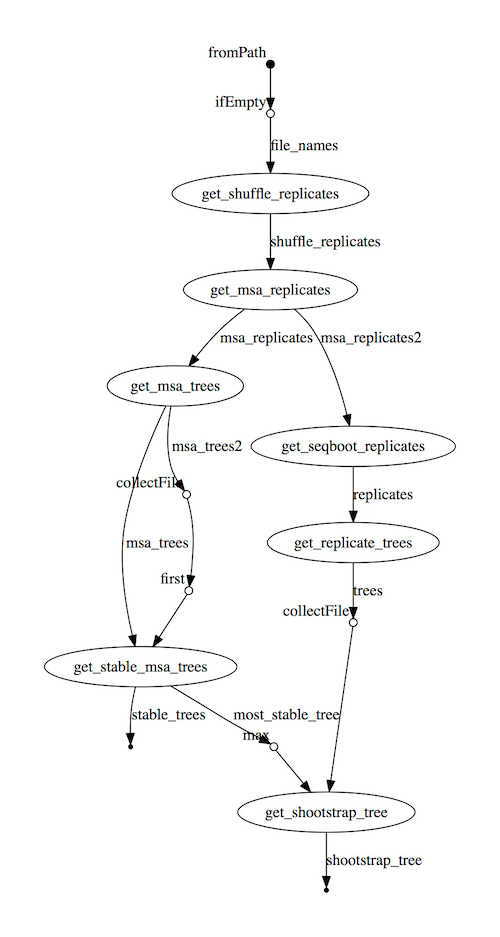
DAG visualisation
A Nextflow pipeline is implicitly modelled by a direct acyclic graph (DAG). The vertices in the graph represent the pipeline’s processes and operators, while the edges represent the data connections (i.e. channels) between them.
The pipeline execution DAG can be outputted by adding the -with-dag option to the run command line.
It creates a file named dag.dot containing a textual representation of the pipeline execution graph
in the DOT format.
The execution DAG can be rendered in a different format by specifying an output file name which has an extension corresponding to the required format. For example:
nextflow run <script-name> -with-dag flowchart.png
List of supported file formats:
| Extension | File format |
|---|---|
| dot | Graphviz DOT file |
| html | HTML file |
| PDF file (*) | |
| png | PNG file (*) |
| svg | SVG file (*) |
Warning
The file formats marked with a * require the Graphviz tool installed in your computer.
The DAG produced by Nextflow for the Shootstrap pipeline: